Elevation Tools
Overview
Reference material for Elevation Tools in WinTAK, sourced from the official WinTAK 5.7 Software User Manual (26 March 2026).
Manual Reference

Select the Elevation Tools icon to open the Heatmap, Viewshed and Contour Lines functionality. The Heatmap shows elevation data on a color scale with lower elevations represented by blue and higher elevations in red.
The Intensity, Saturation, and Value can be modified to user preference. Elevation data needs to be imported for the heatmap to be visible.

Viewshed
The Viewshed Tool allows the ability to choose a position on the map interface and determine visibility from that location based on the surrounding elevation data. Select the Set Viewshed Marker (eye) icon, then select a location on the map or a map marker. An eye marker will appear on the map interface.
If zoomed out too far, the user will only see the Eye View icon and will need to zoom in further to see the viewshed.
A circle will display with green representing areas visible to the viewer and red representing areas that are obstructed from view. The user can modify the viewshed radius. The Height Above Marker can be altered to reflect how far above ground level the viewshed should calculate. Intensity can be increased or decreased using the slide bar. Select Remove Viewshed to delete the viewshed from the map. Press Select Viewshed to show a list of all created viewsheds. Select an individual viewshed name to pan to it on the map. Select the details icon i to view or modify the current viewshed parameters.
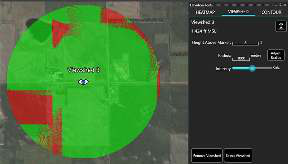
The viewshed radial will open by selecting the Eye icon from the map. Available options are Delete, Fine Adjust and R&B Line.
Settings for Elevation Tools can be changed by navigating to Settings > Tool Preferences > Elevation Overlays Preferences.

Elevation Contour Lines
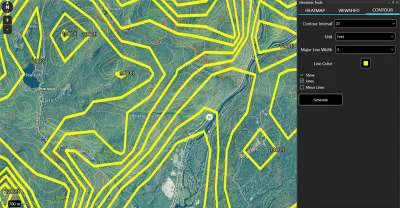
The Contour Lines Tool allows the ability to generate contour lines on the map in the area within the current map view. Select the Contour tab within the Elevation Tools screen. The Generate button becomes active when the map is zoomed to the correct scale (scale varies based on screen resolution). Modify any of the fields desired and then select the Generate button. A progress bar and the percentage complete will appear to give feedback on the contour line generation.
Major Lines, Minor Lines and Labels can be toggled on or off without having to generate the contour lines again. Line color and Major Line Width can be changed after the lines have been generated. If the Interval or units (meters or feet) are modified, select the Generate button to regenerate the contour lines with the new values.
DSM Support
Digital Surface Modeling (DSM) imagery is supported in combination with the elevation heat map and the Mark tool. The imagery files with DSM data can be manually placed in the C:\ProgramData\WinTAK\DSM folder for ingestion. When ingested, no actual imagery will be shown on the map, but it will provide height data for buildings and trees.
Pan to the location of the imagery file, turn on the heatmap and place a Red X in the highlighted area. The Red X will show additional information including Terrain Elevation and Surface Elevation. If Elevation Data is installed, estimated height will also be shown.

Source
WinTAK Software User Manual, Version 5.7, 26 March 2026, pages 73–74.